Chart4PowerApps: A Smarter Way to Visualize Data in Canvas Apps
In a data-driven business environment, how information is presented is as important as the data itself. Users expect dashboards and reports that are clear, fast, and actionable. In Canvas Apps, poor visualisation quickly leads to confusion, low engagement, and missed insights.
Chart4PowerApps enables makers to elevate Canvas Apps with clean, modern, and responsive charts—without complexity, heavy tools, or advanced coding. It is designed specifically for Power Apps makers who want professional-grade data visualisation with minimal effort.
Microsoft PowerApps apps become significantly more effective when data is visual, interactive, and easy to interpret. Chart4PowerApps delivers exactly that.
Why Data Visualisation Matters in Canvas Apps
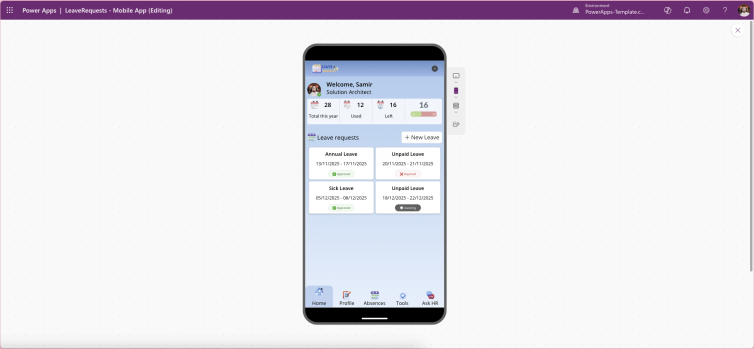
Canvas Apps are often used for:
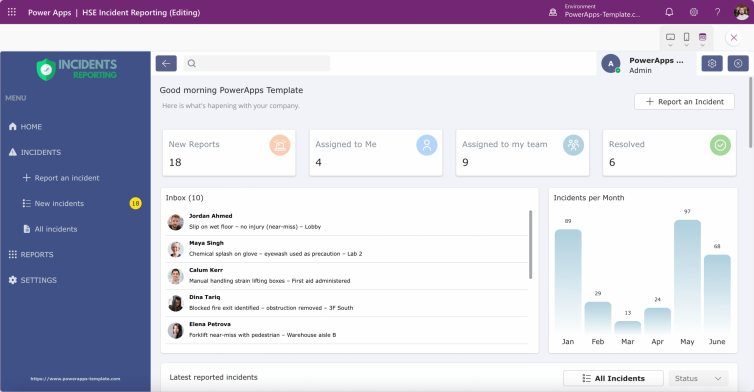
Operational dashboards
Management reporting
Sales and performance tracking
Real-time monitoring tools
When data is displayed as raw lists or tables, users must work harder to understand trends, patterns, and anomalies. Visual charts reduce cognitive load and turn data into decisions.
Modern Power Apps solutions require:
Clear visual hierarchy
Responsive chart layouts
Real-time data updates
Performance-friendly components
Chart4PowerApps is built to meet these expectations natively.
Why Choose Chart4PowerApps?
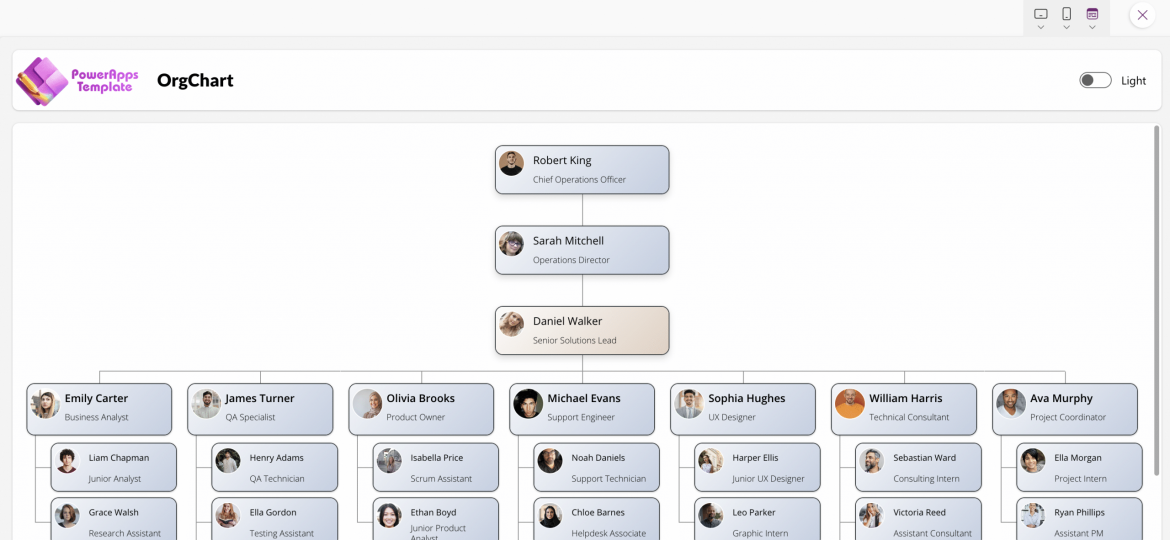
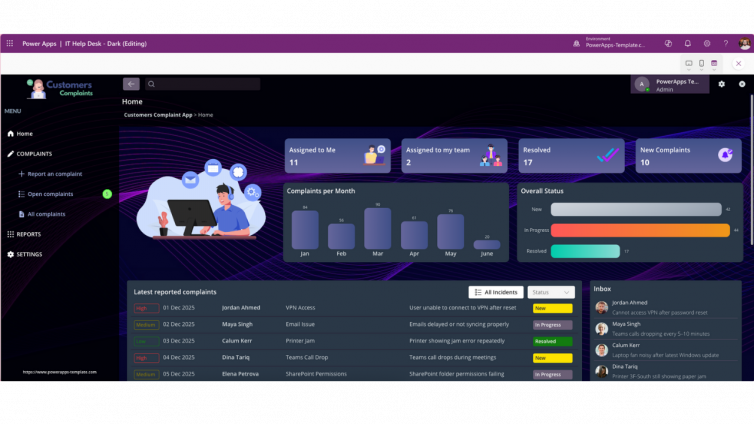
1. A Rich Collection of Chart Types
Chart4PowerApps includes a growing library of essential chart formats, including:
Bar charts
Column charts
Line charts
Pie and donut charts
Additional formats for comparative and trend analysis
Instead of building custom visuals from scratch, makers can drop in a ready-made chart component and instantly preview results directly inside the Canvas App interface.
This dramatically reduces development time while maintaining professional presentation standards.
2. Fully Customisable Reusable Components
Each chart is delivered as a reusable Power Apps component, allowing full control over:
Colours and themes
Labels and data values
Dimensions and scaling
Legends, markers, and annotations
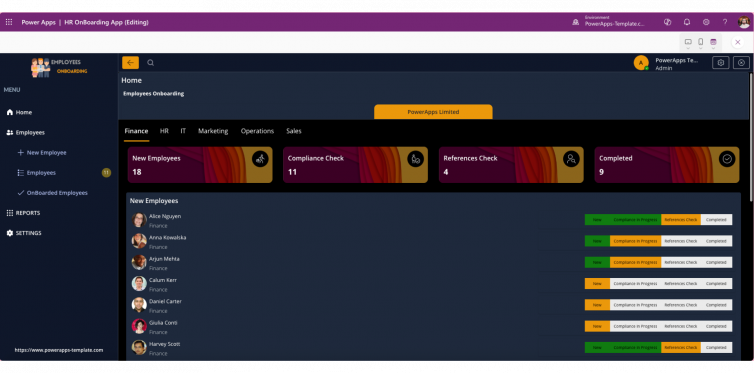
This flexibility ensures charts align seamlessly with:
Corporate branding
Light and dark modes
Custom Power Apps themes
The result is visual consistency across the entire app—without manual styling work.
3. Real-Time Data Support
Business data changes constantly, and dashboards must reflect that reality.
Chart4PowerApps supports live data from:
SharePoint lists
Dataverse tables
Power Apps collections and variables
API data via custom connectors
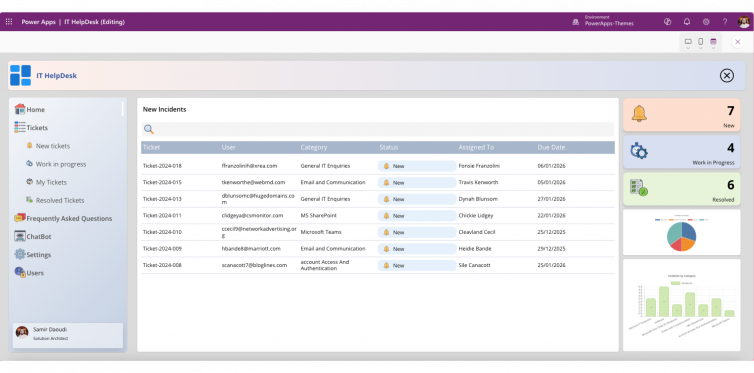
As the underlying data updates, charts refresh dynamically—making Chart4PowerApps ideal for:
Executive dashboards
Operational monitoring
KPI tracking
Management reporting
4. Optimised Specifically for Canvas Apps
Unlike heavy embedded BI tools or external visual frameworks, Chart4PowerApps is purpose-built for Canvas Apps.
The components are:
Lightweight and fast
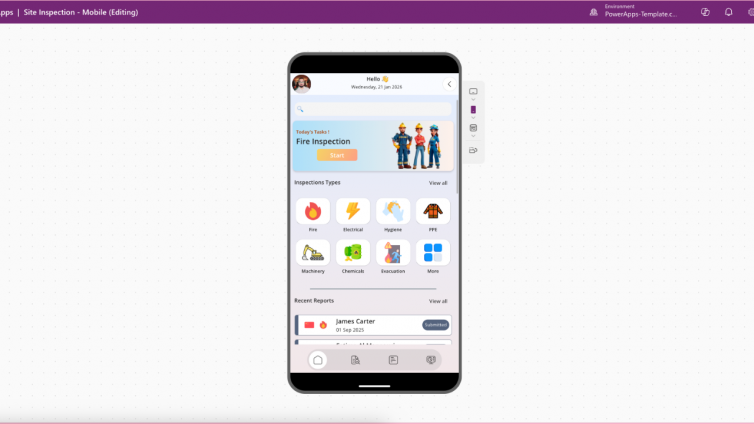
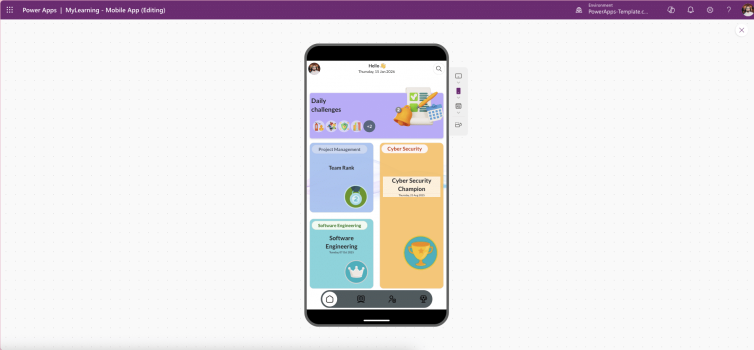
Fully responsive
Mobile- and tablet-friendly
Built using native Power Apps controls
This results in:
Faster load times
Smoother performance
Better user experience across devices
These performance benefits directly impact user adoption and satisfaction.
5. No-Code / Low-Code Friendly by Design
Chart4PowerApps is created for makers not developers.
You do not need:
Advanced coding
PCF control expertise
External JavaScript libraries
Instead, you:
Insert the chart component
Configure properties
Connect your data source
In minutes, a basic form-based app can evolve into a visually rich, data-driven experience.
When Chart4PowerApps Is the Right Choice
Chart4PowerApps is ideal when:
You want professional charts without BI tool overhead
Performance and responsiveness matter
Makers lack advanced development skills
Apps must work across mobile, tablet, and desktop
Data needs to update in real time
👉 Explore related Power Apps templates in the shop to accelerate delivery and enhance data visualisation instantly.
Conclusion: Better Visuals Drive Better Decisions
Data alone is not enough. In Canvas Apps, clarity, speed, and usability define success.
Chart4PowerApps provides a powerful yet simple way to transform raw data into meaningful insights—without sacrificing performance or simplicity. By using reusable, responsive, and no-code-friendly chart components, makers can deliver apps that users trust, understand, and rely on.